September PCE Prices Rose 3.6% From a Year Earlier as Real Disposable Income Fell 0.3%
BEA says the PCE price index rose 0.5% in September and 3.6% from a year earlier, with core prices up 3.1%. Spending rose 0.5%, but inflation-adjusted disposable income fell 0.3% and the saving rate was 3.8%.
By Christopher Salem · 4 min read
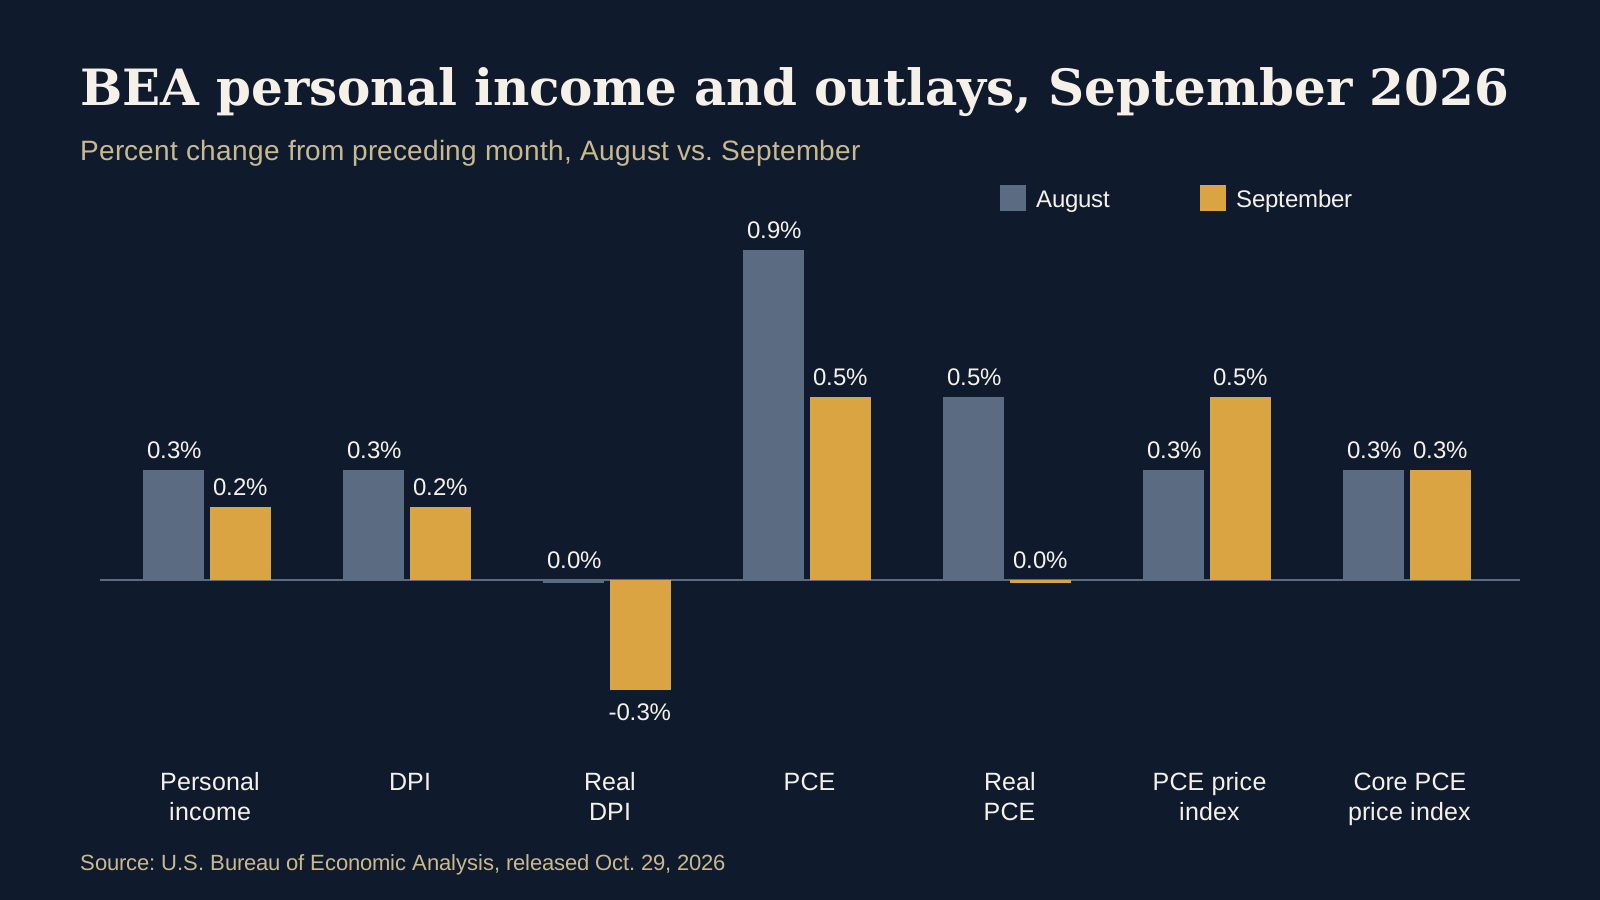
Consumer prices measured by the Personal Consumption Expenditures (PCE) price index rose 0.5% in September and 3.6% from a year earlier, the U.S. Bureau of Economic Analysis reported at 8:30 a.m. ET on Thursday, Oct. 29, 2026. Excluding food and energy, the index rose 0.3% for the month and 3.1% over the year, according to BEA's September personal income and outlays release.
Households spent more in current dollars, but their income did not keep pace with prices. Personal income rose $54.5 billion, or 0.2%. Disposable personal income (DPI), which is income after personal current taxes, rose $52.7 billion, also 0.2%. After adjusting for prices, real DPI fell 0.3%.
Spending and saving
Personal consumption expenditures rose $113.1 billion, or 0.5%, with $35.1 billion more spent on goods and $78.1 billion more on services. Real PCE rose $2.6 billion, which BEA described as less than 0.1% at a monthly rate. Personal saving was $911.1 billion, and the personal saving rate was 3.8% of disposable income.
| Measure | August 2026 | September 2026 |
|---|---|---|
| Current-dollar personal income | 0.3% | 0.2% |
| Current-dollar DPI | 0.3% | 0.2% |
| Real DPI | 0.0% | -0.3% |
| Current-dollar PCE | 0.9% | 0.5% |
| Real PCE | 0.5% | 0.0% |
| PCE price index | 0.3% | 0.5% |
| PCE price index excluding food and energy | 0.3% | 0.3% |
Source: U.S. Bureau of Economic Analysis, Personal Income and Outlays, September 2026, released Oct. 29, 2026. July and August estimates were revised with this release.
BEA said the income gain mainly reflected higher compensation, led by private wages and salaries, and higher government social benefits, led by Medicare.
Why mortgage borrowers watch this report
PCE inflation is the price measure the Federal Reserve uses for its 2% inflation goal, so the report is one input that investors weigh when pricing interest rates. It is not a mortgage rate. Mortgage rates are set by lenders and are influenced by many factors, including longer-term Treasury yields, mortgage-backed securities demand, credit risk and lender costs. This release does not report mortgage rates and cannot by itself say where they will go next.
For households, the more direct takeaway is the gap between spending and real income. A 0.3% drop in inflation-adjusted disposable income alongside a 3.8% saving rate means less cushion in monthly budgets, which matters when lenders evaluate debt-to-income ratios and reserves.
What to do with the data
- Base payment plans on a written Loan Estimate, not on a single economic report.
- Compare offers from more than one lender on the same day, including points and fees.
- Ask a lender how its rate-lock policy works and what a lock extension would cost.
The next personal income and outlays release, covering October, is scheduled for Nov. 25, 2026, at 8:30 a.m. ET.
Cover: native chart by mortgage.news from BEA's published monthly percent changes.