Case-Shiller: Home Prices Up 2.1% in August, Still Down After Inflation
The S&P Cotality Case-Shiller national index rose 2.1% from a year earlier in August, but 3.4% inflation means real home prices fell for a 15th straight month. Chicago led and Seattle trailed.
By Aida Yousif · 4 min read
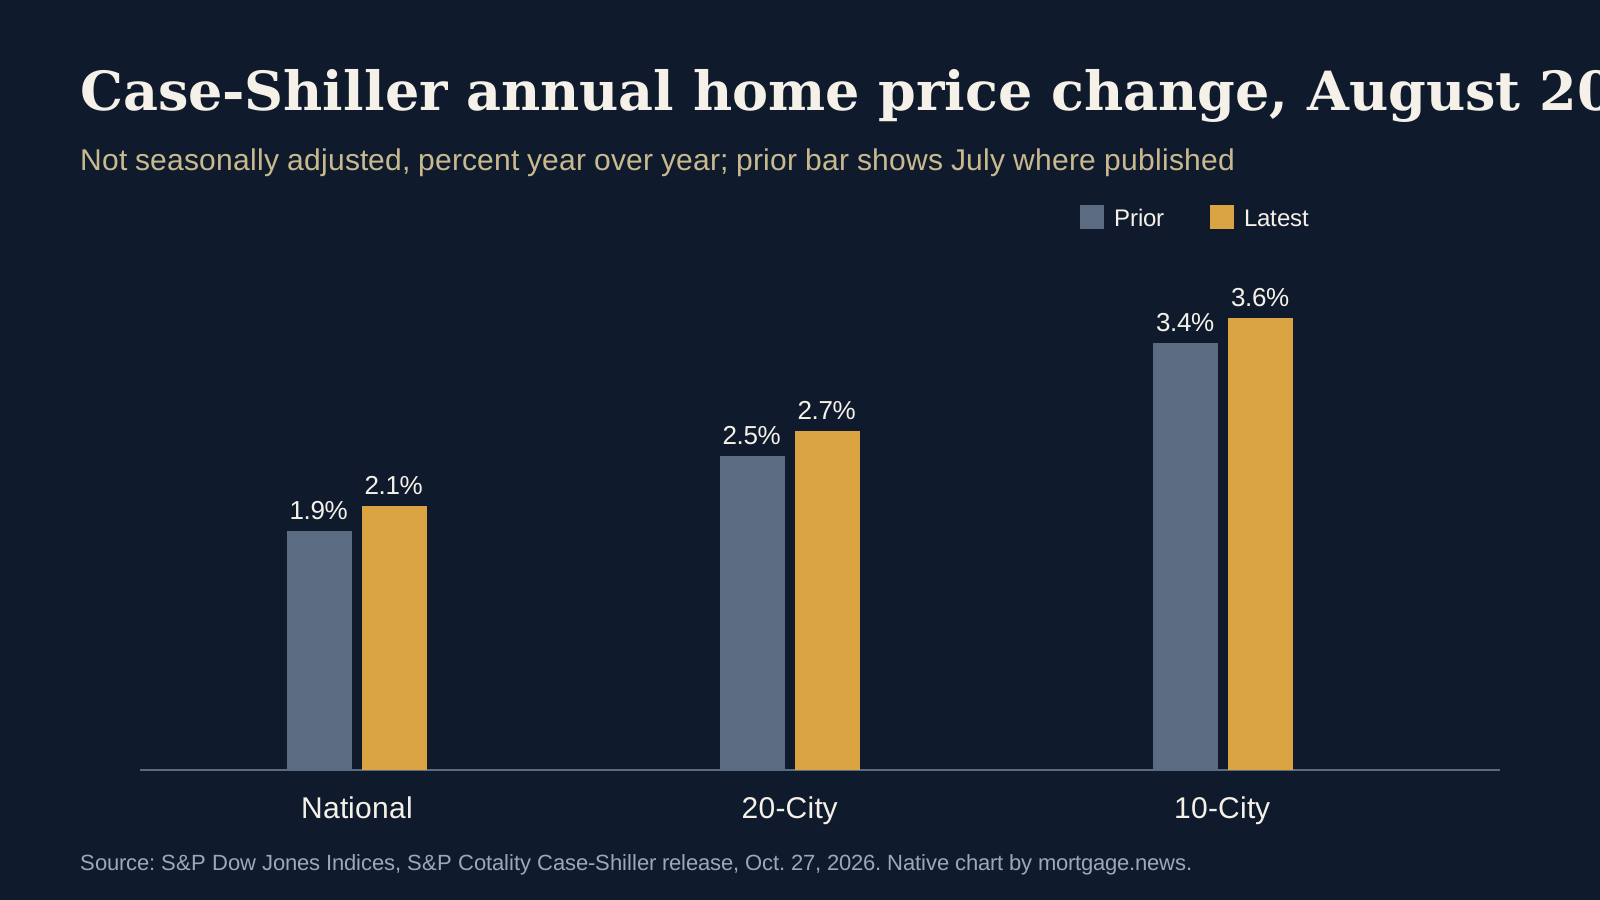
U.S. home prices rose 2.1% in the year through August 2026, up from a 1.9% annual gain in July, according to the S&P Cotality Case-Shiller U.S. National Home Price NSA Index released Tuesday, Oct. 27, by S&P Dow Jones Indices. Adjusted for inflation, though, prices fell for a 15th consecutive month, because consumer prices rose 3.4% over the same period.
National, composite and city results
| Index | July 2026 | August 2026 |
|---|---|---|
| U.S. National | +1.9% | +2.1% |
| 20-City Composite | +2.5% | +2.7% |
| 10-City Composite | +3.4% | +3.6% |
| Chicago (highest) | Not shown | +6.7% |
| New York | Not shown | +6.2% |
| Cleveland | Not shown | +4.3% |
| Seattle (lowest) | Not shown | -2.0% |
Source: S&P Dow Jones Indices, Oct. 27, 2026. Detroit has no valid August value; see below.
Chicago led the 20 cities for a sixth straight month. Seattle had the largest annual decline for a third straight month, followed by Las Vegas at -1.3% and Denver at -0.8%. The spread between Chicago and Seattle was nearly 9 percentage points.
Nominal versus real
The 2.1% figure is nominal: it compares August prices with August a year ago in current dollars. With inflation at 3.4%, a home that tracked the national index lost about 1.3 percentage points of purchasing power. A real decline does not mean prices fell in dollars. It means they rose more slowly than other prices.
Why the monthly numbers point in different directions
Before seasonal adjustment, the National Index fell 0.2% from July to August, and both the 10-City and 20-City composites fell 0.4%. After seasonal adjustment, the National Index rose 0.3%, the 10-City 0.4% and the 20-City 0.3%. Home sales and prices normally cool after summer, and seasonal adjustment removes that expected pattern. S&P's Rebecca Kaufman said the divergence "suggests that the typical post-summer slowdown is obscuring some underlying strength in home prices."
Detroit's missing month
S&P said Cotality is still facing transaction recording delays in Wayne County, the most populous county in the Detroit metro. There was no valid August update for the Detroit index in this release, though a July update was published. S&P said it will fill in the missing months as data arrive.
How this differs from FHFA's index
Readers may also have seen the Federal Housing Finance Agency's August index, which showed a 2.4% annual gain. The two are not interchangeable. Case-Shiller uses repeat sales of single-family homes from public records regardless of how they were financed, and its headline national figure is not seasonally adjusted. FHFA's headline index is seasonally adjusted and limited to homes with conforming loans backed by Fannie Mae or Freddie Mac. Both measure past sales, not the value of any one home.
For buyers and homeowners, the lesson from both is the same: local results vary widely, and recent comparable sales nearby matter more than a national average.
Source: S&P Dow Jones Indices, "S&P Cotality Case-Shiller Index Reports Annual Gain in August 2026," Oct. 27, 2026. Cover: native chart by mortgage.news from the release.