U.S. Home Prices Rose 2.4% in August, but Regional Gaps Widened
FHFA reports August home prices up 0.3% monthly and 2.4% annually. A 4.4% gain in the East North Central contrasts with just 0.5% in the Mountain region, showing why local data matters.
By Anthony Brikho · 5 min read
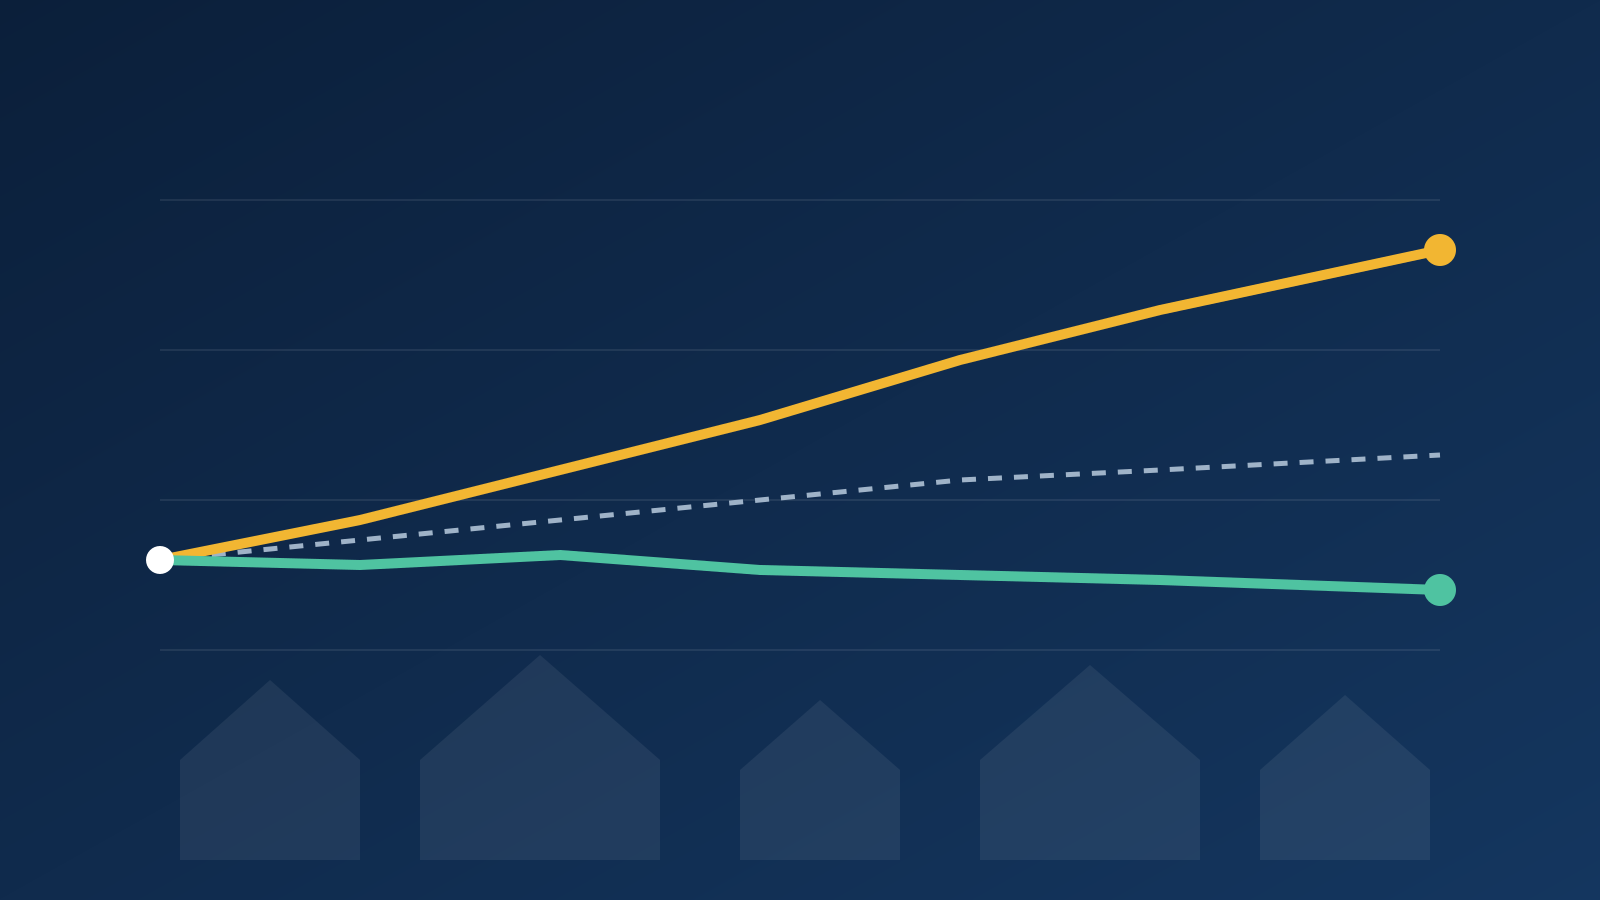
U.S. single-family home prices continued to edge higher in August, but the national average concealed sharply different regional conditions. The Federal Housing Finance Agency (FHFA) reported on October 27 that its seasonally adjusted House Price Index rose 0.3% from July to August 2026 and 2.4% from August 2025.
That is modest national appreciation, not a uniform gain for every homeowner. For mortgage borrowers, buyers and lenders, the more useful story is how much the numbers vary by region—and what the index does and does not measure.
The national reading: modest gains, with a revision
FHFA also revised July's monthly price increase down to 0.2%, from the 0.3% previously reported. Revisions are a reminder that the first reading is an estimate built from transactions available at the time. A one-month movement should not be treated as a guaranteed trend.
Home-price appreciation is still positive in nominal terms nationwide, but a 2.4% annual change says little on its own about whether a specific home is affordable. The monthly mortgage payment also depends on the purchase price, down payment, loan type, interest rate, taxes, insurance, and any mortgage insurance or association dues.
The regional divide is the headline
Across the nine U.S. census divisions, August's month-to-month changes ranged from a 0.8% decline in New England to a 2.1% increase in the East South Central division. Looking at the 12 months through August, the East North Central gained 4.4%, the strongest division-level annual increase, while the Mountain division rose just 0.5%.
Those gaps matter when setting expectations for a purchase appraisal, a refinance or a potential cash-out transaction. Even within the same division, different metro areas, neighborhoods and property types can move in different directions. A nationwide price headline cannot replace a local comparable-sales analysis.
What FHFA's index actually measures
FHFA's flagship index uses a repeat-sales approach to track price changes in single-family properties financed with conventional conforming mortgages purchased or securitized by Fannie Mae and Freddie Mac. It draws on historical transaction records and adjusts for seasonal patterns. The method is valuable for tracking changes over time, but it is not a count of all home sales and does not directly measure every cash purchase or property segment.
It is also a price index—not a home appraisal, an estimate of a particular property's current value, or a measure of how much equity any individual borrower can access. Those questions require property-specific information and lender guidelines.
What buyers and homeowners should take from the report
For buyers: Check recently closed comparable sales in the target neighborhood and calculate the full monthly housing expense, rather than assuming the national price trend will determine the deal. A lower asking price can be offset by financing costs, while concessions may change the effective economics.
For homeowners considering a refinance: Updated property value can affect loan-to-value ratios and potential loan options, but equity alone does not establish whether refinancing makes sense. Compare the current and proposed payment, closing costs, interest over the expected holding period, and the time required to recover costs. Cash-out refinancing also increases or restructures debt secured by the home.
For loan originators: Explain the distinction between market-wide appreciation and an appraiser's supported value. Where a valuation falls short of expectations, focus on relevant recent comparables and a documented reconsideration process when warranted, not broad national appreciation percentages.
What comes next
FHFA's next scheduled House Price Index release is November 24, 2026, covering September monthly data and the third quarter. It will offer another reading on whether modest national gains persist and whether regional performance begins to converge.
Source: Federal Housing Finance Agency, October 27, 2026. This article is general market information, not a property valuation or individualized loan recommendation.