Home Prices Rose in 78% of Metro Areas in Q3 2026 as the National Median Hit $432,900
NAR says prices rose year over year in 78% of metro areas in the third quarter, down from 80%, and the national single-family median rose 1.7% to $432,900. The West was the only region with a decline, at 0.6%.
By Aida Yousif · 4 min read
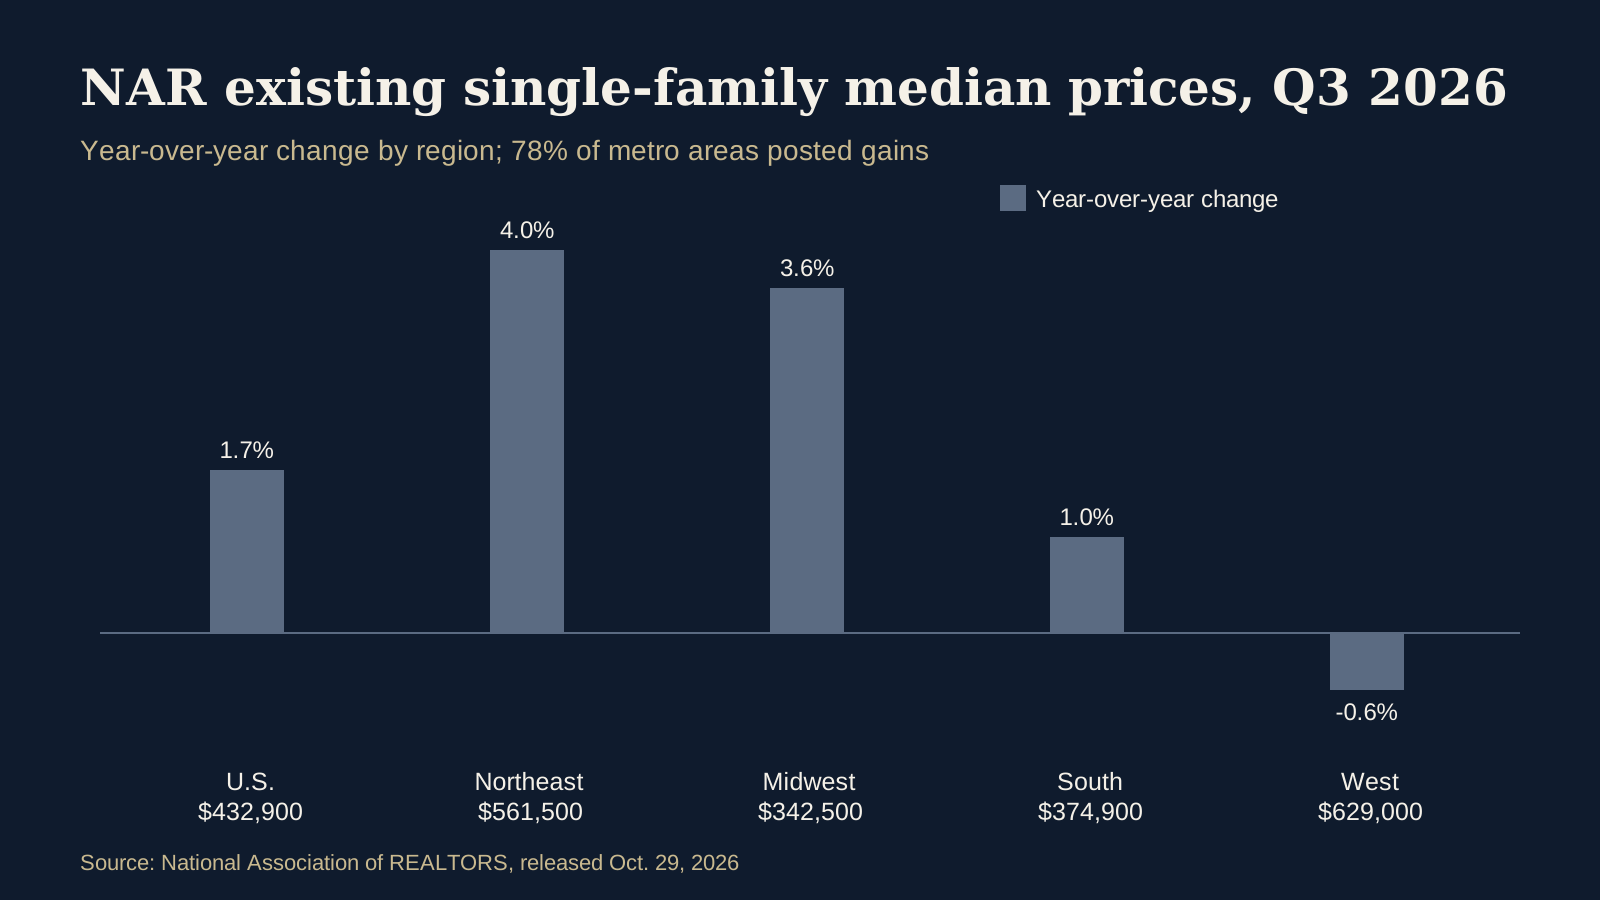
Existing single-family home prices rose from a year earlier in 78% of metro areas during the third quarter of 2026, down from 80% in the second quarter, the National Association of REALTORS reported at 10 a.m. ET on Thursday, Oct. 29, 2026. The national median single-family existing-home price rose 1.7% to $432,900, matching the revised annual growth rate in the second quarter, according to NAR's quarterly metro price release.
Four percent of metro areas posted double-digit gains, down from 5% last quarter, and 21% of markets had declining prices, up from 20%. NAR tracks roughly 235 metropolitan statistical areas.
Regional medians
| Region | Median price | Year-over-year change |
|---|---|---|
| United States | $432,900 | +1.7% |
| Northeast | $561,500 | +4.0% |
| Midwest | $342,500 | +3.6% |
| South | $374,900 | +1.0% |
| West | $629,000 | -0.6% |
Source: National Association of REALTORS, "Home Prices Increased in 78% of Metro Areas in Third Quarter of 2026", Oct. 29, 2026. Metro tables: NAR metropolitan median area prices and affordability.
Among large markets, Gulfport-Biloxi-Pascagoula, Miss., had the biggest annual gain at 11.0%, followed by Rochester, N.Y., at 10.9% and Jackson, Miss., at 10.1%. San Jose-Sunnyvale-Santa Clara, Calif., remained the most expensive market, with a $1,920,000 median, up 0.3%. Salinas-Monterey, Calif., was the only market on NAR's top-10 most-expensive list with a decline, at 7.0%.
Affordability measures
NAR estimated the monthly mortgage payment on a typical existing single-family home with 20% down at $2,251, up $48 from last quarter and $69 from a year earlier. Typical families spent 24.1% of income on mortgage payments, up from 23.9% last quarter but down from 24.5% a year earlier.
For first-time buyers, NAR estimated a $2,208 monthly payment on a typical $368,000 starter home with 10% down. That payment took 36.3% of income, up from 36.0% last quarter and down from 37.0% a year earlier. These are NAR's modeled estimates for typical households, not quotes for any borrower.
NAR Chief Economist Lawrence Yun said home prices "continue to set record highs in most parts of the country" despite affordability challenges, and noted that nearly all Florida markets showed gains this quarter after declines over the past year.
Reading the numbers carefully
NAR cautions that median prices reflect the mix of homes sold and that the only valid comparison is with the same period a year earlier, because of seasonal buying patterns. Regional medians come from a separate sample that includes rural areas, so they do not necessarily move with the large metros.
- Check your own metro's figure in NAR's tables or with a local association before drawing conclusions.
- Run a payment estimate at your own price, down payment and quoted rate rather than relying on a national average.
Cover: native chart by mortgage.news from NAR's published regional figures.